Published 12th June 2024
My hands on Vue 3 Chart Libraries
Chart libraries for data visualization in Vue 3 in my experience as a web developer

In my experience as a web developer, data visualization plays a crucial role in making complex data more accessible and understandable. For frontend developers working with Vue 3 and Nuxt, choosing the right visualization chart library is essential to creating engaging and interactive user experiences. The right library can save time, enhance the functionality of your application, and provide beautiful, responsive charts that convey your data effectively.
Vue 3 and Nuxt offer powerful frameworks for building modern web applications, and there are several chart libraries designed to integrate seamlessly with these tools. In this article, I'll review five popular visualization chart libraries that I have worked with: Chart.js, ECharts, ApexCharts, D3.js, and Highcharts. I'll explore their features, ease of integration, pros and cons, and best use cases to help you make an informed decision for your next project.
Chart.js
Features
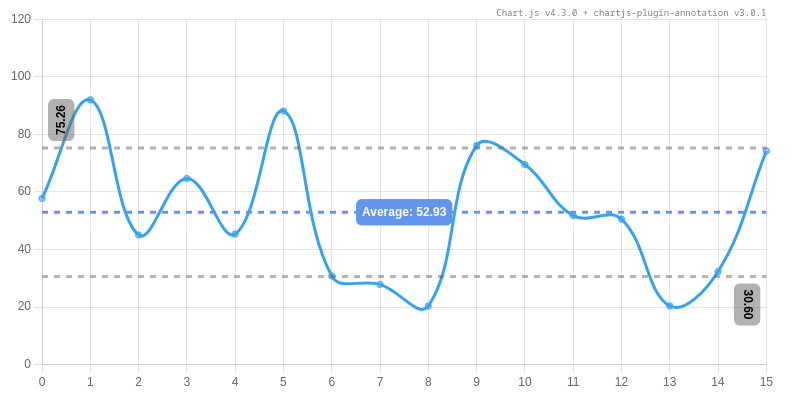
Chart.js is a simple yet flexible JavaScript charting library that supports eight chart types: bar, line, area, pie, radar, polar area, bubble, and scatter. It is designed to create responsive and animated charts that are easy to use and customize.
Integration with Vue 3 and Nuxt
In my projects, I’ve used Vue Chart.js, a wrapper for Chart.js, which makes it easy to use with Vue 3 and Nuxt. It provides Vue components for each chart type, allowing you to integrate charts into your Vue components seamlessly.
Pros and Cons
Pros:
- Easy to get started with and use.
- Good documentation and a wide range of examples.
- Lightweight and responsive, making it suitable for mobile devices.
- Supports animations and interactions out of the box.
Cons:
- Limited chart types and customization options compared to more advanced libraries.
- May require additional plugins for complex data visualizations.
Use Cases
I’ve found Chart.js to be ideal for simple charts and quick implementations. It’s perfect for dashboards, reports, and any application where you need to display straightforward data visualizations without a steep learning curve.
Community Support
Chart.js has a strong community, extensive documentation, and numerous examples and tutorials available. This makes it a good choice for developers looking for a reliable and well-supported charting library.
Link: https://www.chartjs.org
ECharts
Features
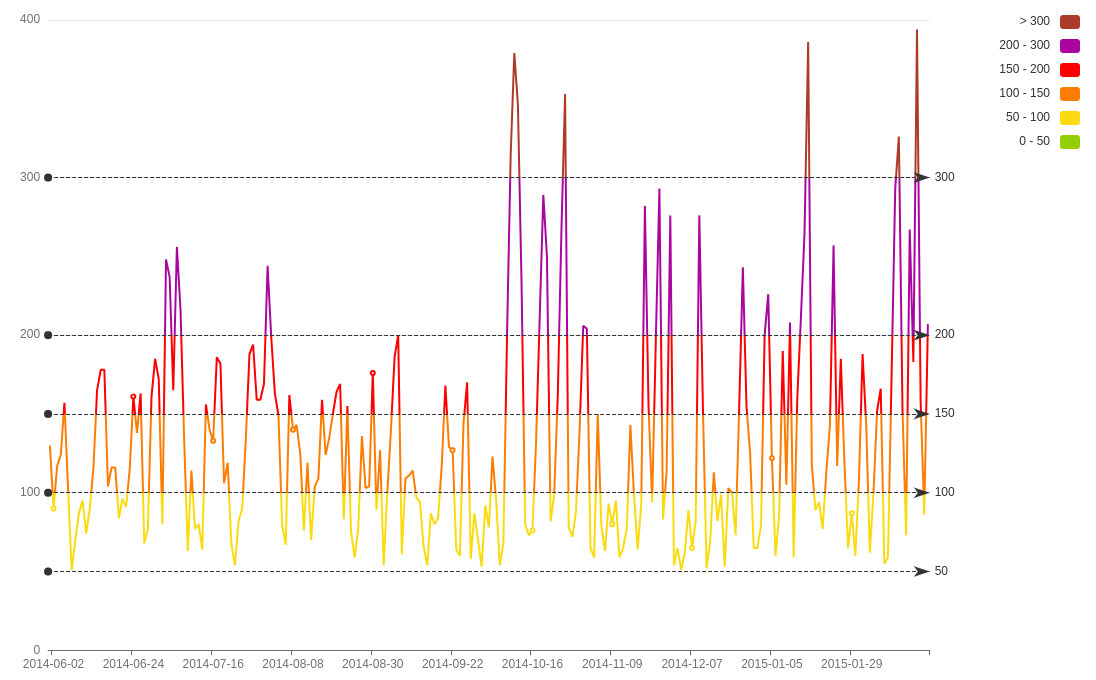
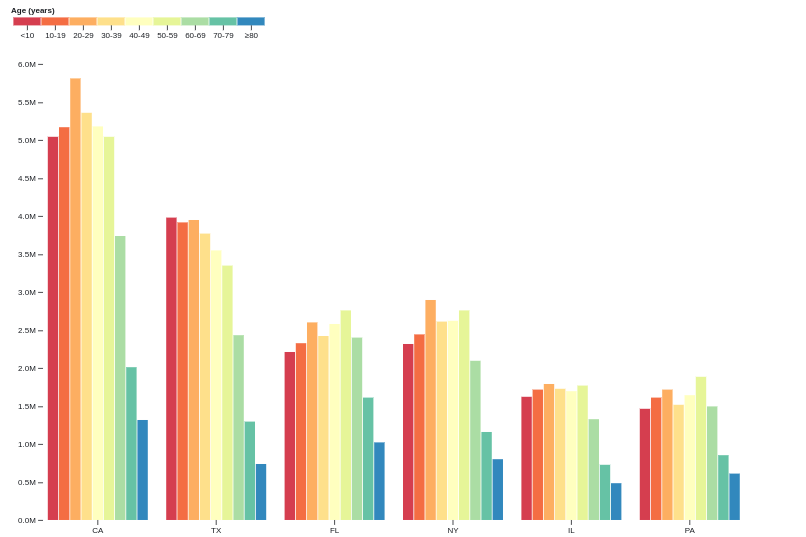
ECharts is a powerful, highly customizable visualization library developed by Baidu. It supports a wide range of chart types, including bar, line, pie, scatter, map, and more. ECharts is particularly known for its ability to handle large datasets and provide complex, interactive visualizations, including 3D charts.
Integration with Vue 3 and Nuxt
I’ve integrated ECharts with Vue 3 using the Vue-ECharts library, which provides Vue components for ECharts. This wrapper simplifies the process of incorporating ECharts into your Vue components and Nuxt pages.
Pros and Cons
Pros:
- Highly customizable and flexible, allowing for intricate and unique visualizations.
- Excellent performance with large datasets, thanks to its efficient rendering engine.
- Supports a wide range of chart types, including 3D and map visualizations.
- Rich set of interactive features, such as tooltips, zooming, and data exploration.
Cons:
- Steeper learning curve compared to simpler libraries like Chart.js.
- More complex integration process, requiring a deeper understanding of both ECharts and Vue.
Use Cases
ECharts is well-suited for complex, highly customizable visualizations where performance with large datasets is crucial. It is ideal for applications that require detailed and interactive charts, such as data analysis tools, business intelligence dashboards, and scientific research platforms.
Community Support
ECharts boasts strong community support, with detailed documentation and numerous examples available. The library is actively maintained, and there is a growing number of tutorials and third-party resources to help developers get the most out of ECharts.
ApexCharts
Features
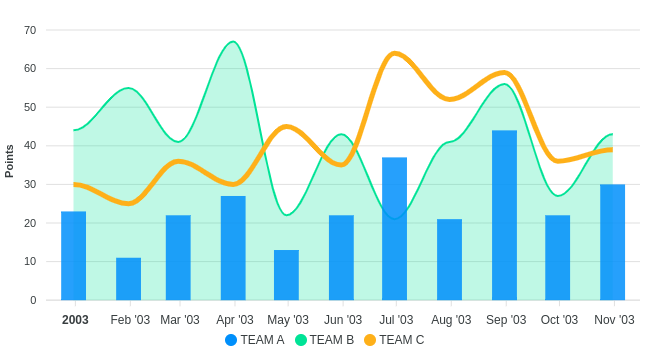
ApexCharts is a modern charting library that focuses on delivering interactive and responsive charts with a wide range of features. It supports a variety of chart types, including line, bar, area, pie, and mixed charts, and emphasizes performance and flexibility.
Integration with Vue 3 and Nuxt
I’ve used ApexCharts with Vue 3 via the Vue-ApexCharts wrapper. This wrapper provides Vue components for each chart type, making it easy to use ApexCharts within your Vue applications.
Pros and Cons
Pros:
- Easy to use and integrate, with straightforward API and documentation.
- Responsive and interactive charts that work well on both desktop and mobile devices.
- Good customization options, allowing for tailored chart designs.
- Supports a variety of chart types and combinations.
Cons:
- Less support for highly complex visualizations compared to ECharts or D3.js.
- Limited features for handling very large datasets.
Use Cases
ApexCharts is best for creating interactive dashboards and applications that require a variety of chart types with moderate complexity. It is suitable for business dashboards, financial reports, and any application needing responsive and interactive data visualizations.
Community Support
ApexCharts has an active community and comprehensive documentation. The library is frequently updated, and there are plenty of examples and tutorials available to help developers get started and solve common issues.
D3.js
Features
D3.js is a highly flexible and powerful library for creating dynamic, interactive data visualizations. It provides low-level tools for binding data to the DOM and applying data-driven transformations, allowing for custom visualizations.
Integration with Vue 3 and Nuxt
I’ve integrated D3.js directly with Vue 3, and sometimes used wrappers like vue-d3-network for easier integration. This flexibility allows developers to choose the best approach for their specific needs.
Pros and Cons
Pros:
- Extremely powerful and flexible, enabling the creation of unique and complex visualizations.
- Wide range of plugins and extensions available to extend functionality.
- Excellent performance and control over the visualization process.
Cons:
- Steep learning curve, requiring a good understanding of both D3.js and data visualization principles.
- More complex integration process compared to higher-level libraries.
Use Cases
D3.js is ideal for custom and complex data visualizations where unique or advanced features are required. It is perfect for scientific research, data journalism, and any project where standard chart libraries do not provide enough flexibility.
Community Support
D3.js has a large and active community, with extensive documentation, numerous plugins, and a wealth of tutorials and examples available. This support makes it a go-to choice for developers needing advanced data visualization capabilities.
Highcharts
Features
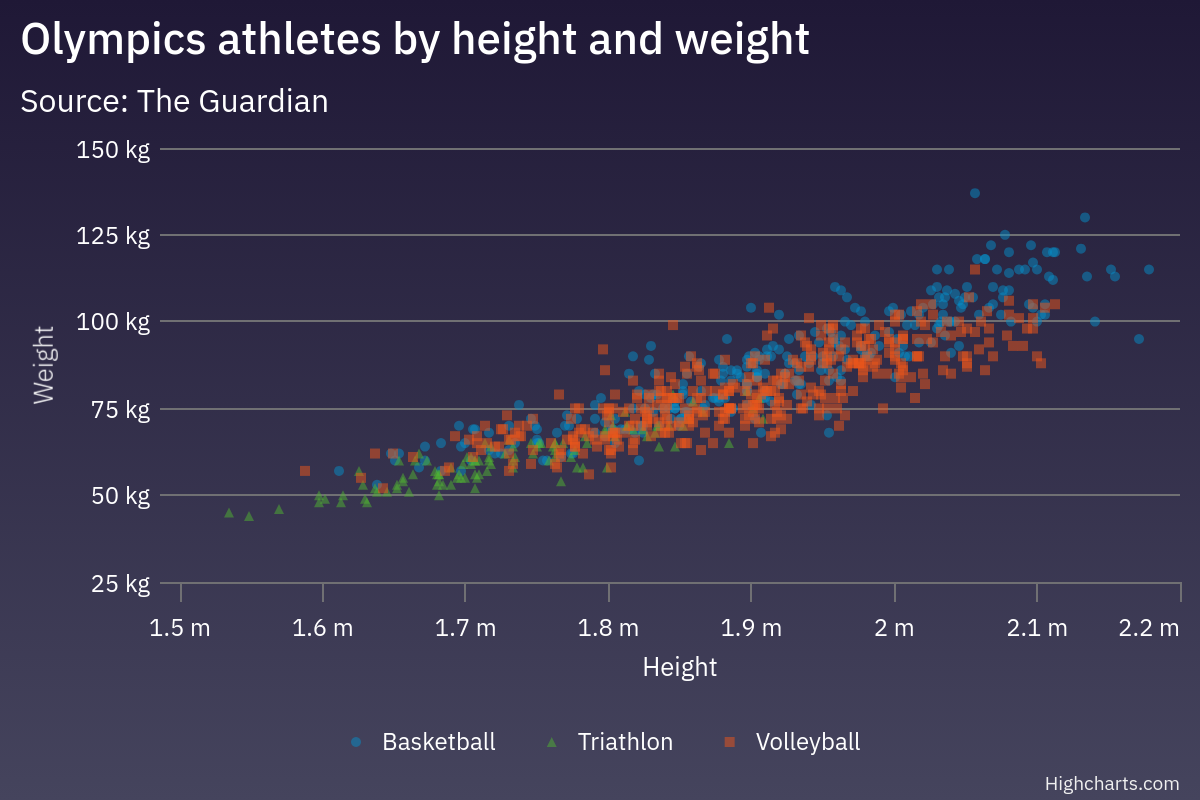
Highcharts is a mature charting library known for its high-quality rendering and extensive chart options. It supports a wide range of chart types, including line, bar, column, pie, and more, with a focus on delivering polished and interactive visualizations.
Integration with Vue 3 and Nuxt
I’ve used Highcharts with Vue 3 through the Highcharts-Vue wrapper. This official wrapper provides Vue components for Highcharts, streamlining the integration process.
Pros and Cons
Pros:
- High-quality, professional-grade visualizations with a polished look.
- Extensive customization options and powerful features.
- Good performance and support for interactive features.
Cons:
- Requires a commercial license for non-personal use, which can be a drawback for smaller projects.
- More complex for beginners compared to simpler libraries like Chart.js.
Use Cases
Highcharts is suitable for commercial applications that require high-quality charts with extensive customization options. It is ideal for enterprise-level dashboards, financial reporting tools, and any project where the quality and polish of the visualizations are paramount.
Community Support
Highcharts has strong community support, detailed documentation, and a range of tutorials and examples. Additionally, commercial support is available for enterprises needing dedicated assistance.
Conclusion
Choosing the right visualization chart library for your Vue 3 and Nuxt projects depends on your specific needs and the complexity of the visualizations you require.
- For simple and quick implementations, Chart.js is an excellent choice due to its ease of use and straightforward integration.
- If you need highly customizable and powerful charts, ECharts offers robust features and great performance with large datasets.
- For interactive and responsive dashboards, ApexCharts provides a good balance of ease of use and flexibility.
- When your project demands custom and complex visualizations, D3.js stands out with its unparalleled flexibility and power.
- For high-quality, professional-grade charts, Highcharts delivers polished and interactive visualizations suitable for commercial applications.
By understanding the strengths and limitations of each library, you can make an informed decision that best fits your project's requirements. Happy coding!
Credit
All screenshots are from respective chart library official website.
Thank you Akshara Hegde
To read the full article, click the link below.
https://aksharahegde.xyz/blog/visualization-libraries-i-worked-on